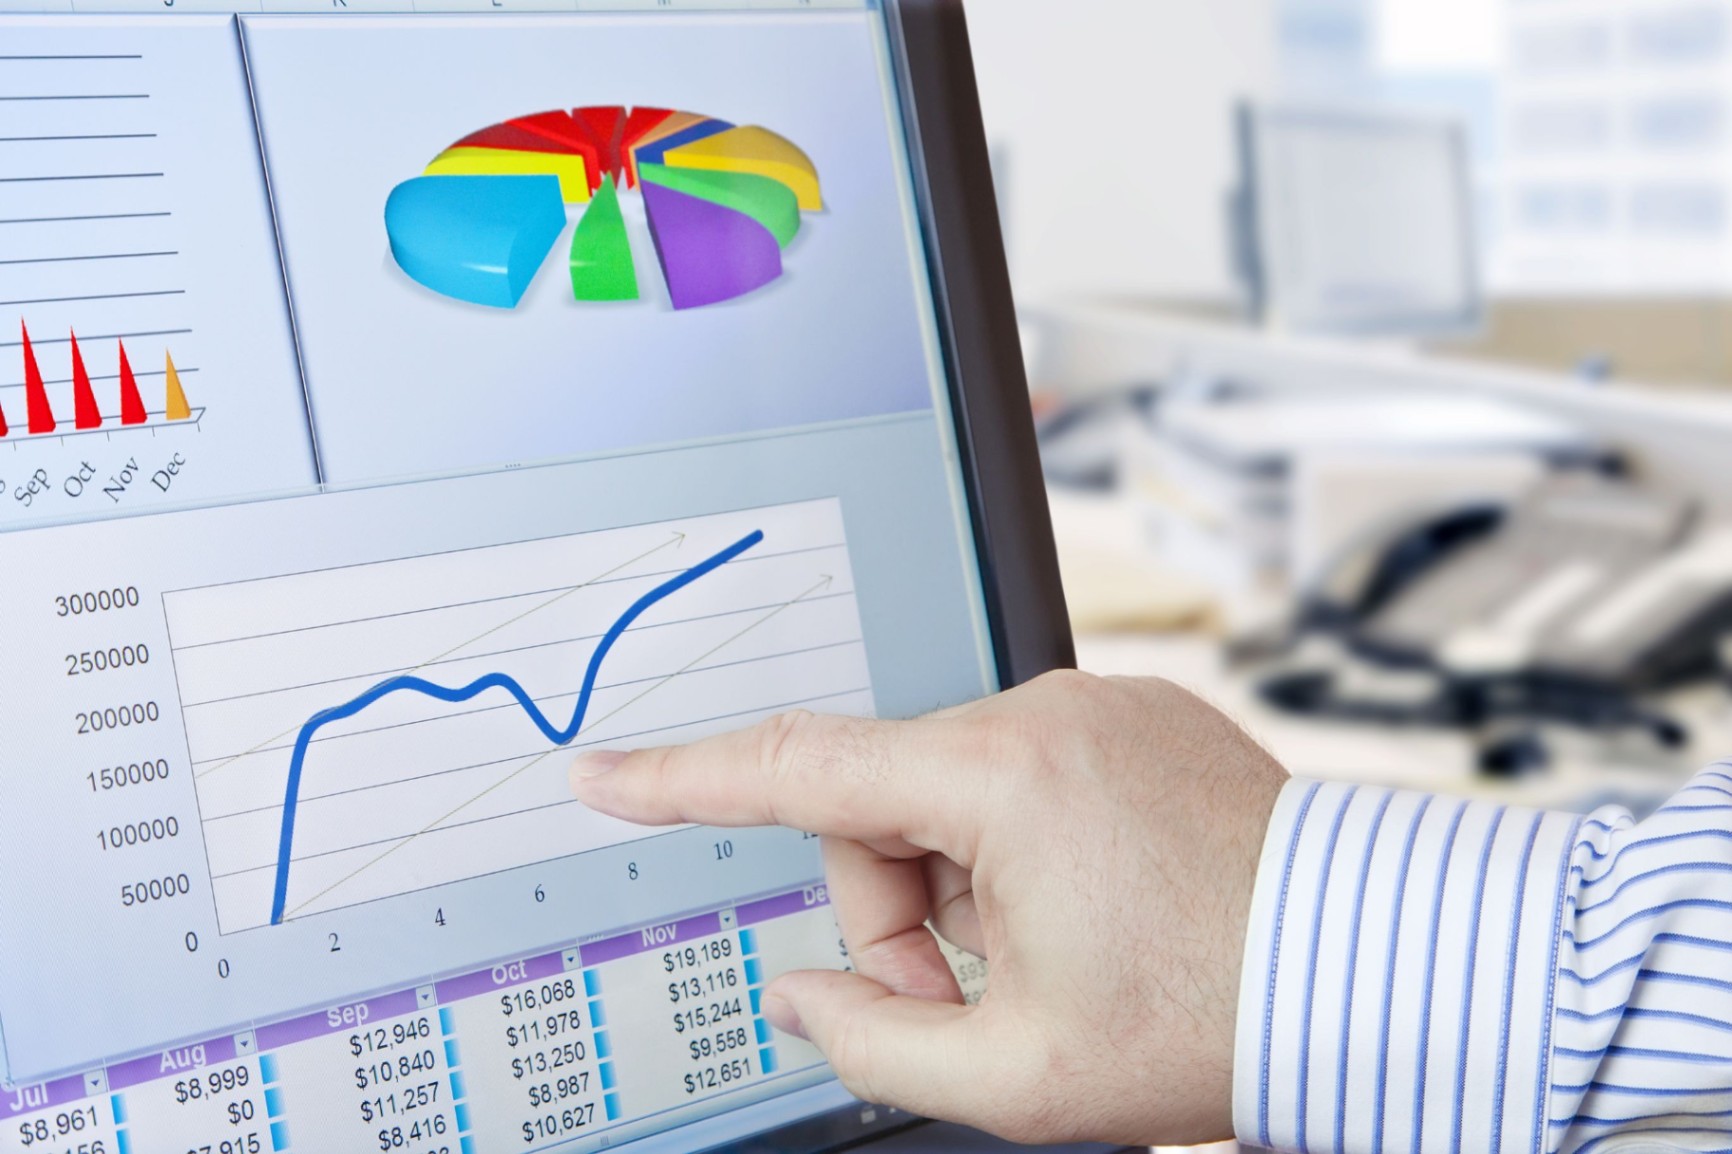
Unlock the power of visual data insights to improve performance and maximize efficiency
We specialize in providing advanced data visualization solutions for organizations seeking clarity and precision in their decision-making processes. Our approach is focused on transforming complex datasets into accessible, dynamic, and meaningful visuals that allow businesses to operate with agility and confidence. With our expertise, companies across Germany benefit from improved transparency, better forecasts, and enhanced competitiveness in their markets.
Data-driven Expertise
Our team consists of experienced professionals skilled in data science, analytics, and visualization. Each project is built with precision to ensure that our clients receive the highest quality of insights and actionable recommendations. We focus on creating tailored dashboards that align perfectly with industry-specific requirements and support sustainable business growth through clarity in decision-making.
Innovative Solutions
We implement the latest technologies and visualization tools to provide modern and efficient solutions. Our innovative approach ensures that businesses remain ahead in their industries by using data more effectively. We continuously optimize our methods to deliver seamless integration, adaptability, and real-time results that give our clients an unmatched advantage in the marketplace.
Client-Centered Approach
Every solution we create is customized according to the specific needs of our clients. By focusing on industry challenges, internal processes, and unique company goals, we ensure that our visualization tools provide maximum value. Our client-first philosophy ensures trust, transparency, and long-term collaboration that goes beyond one-time projects.
Reliable Insights
We guarantee that our data visualization solutions provide reliable and transparent results. Our visuals are designed to eliminate uncertainty, reduce risks, and enhance business intelligence processes. With clarity and accuracy, our clients can confidently make decisions that drive measurable success in highly competitive environments.
Sustainable Growth
Our services are designed not only for immediate improvement but also for long-term value. By implementing scalable solutions, we ensure that businesses continue benefiting as they grow. With us, organizations can create a sustainable digital foundation that enhances productivity and ensures ongoing competitiveness.